


“When should I sell my wheat?” This question is something every wheat grower has to work through each crop year, but there is an implied condition that is not stated. “When should I sell my wheat and get a good price!” No one wants to sell their wheat at a low price, but the wheat market is hard to predict, and what is a good price? A good price can only be determined after the fact by looking backwards at the market prices, and we have to look forward toward the unknown. In addition to the desire to do a good job of marketing, cash flow needs and maintenance of working capital need to be balanced with your marketing goals.
Let’s break out the factors in the questions stated above. WHEN to sell. Every day there is a wheat market price stated by our local grain companies. It is easy to put those prices into a seasonal chart where the percentage of the marketing range each year is averaged over a number of years. Now we need to add GOOD PRICE into our calculations. The definition of a good price may be different for each individual, and it depends on how you currently grade yourself for your marketing ability. You need to make achieving a good price a marketing goal, and as with any goal, it should be something that can be achieved, but also hard to reach. There is an old adage that two-thirds of the wheat crop is bought in the bottom third of the market range. I’ve found this to be sadly true. But what isn’t said is how much wheat was bought in the middle and top third of the market range. Only a small fraction of the crop is bought in the top third of the market range, which makes this our good price goal.
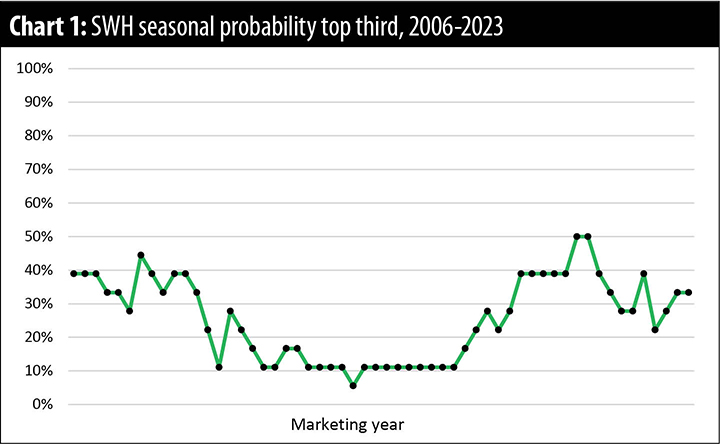
Let’s take a look at our original question, when is the best time to sell wheat (May to April)? You can see in Chart 1 there is only a short time, in February, that you have a 50% chance of selling in the top third of the market range. This graph shows the difficulty growers face each year with the desire to do a good job of marketing. But can something be done to improve this situation? Can we use analytics to improve our odds and meet our marketing goals? Analytics is a process where we use data and statistics to predict a future event based on historical patterns. The use of analytics has been especially popular in athletics and was featured in the movie “Moneyball” and is also used in weather forecasting.
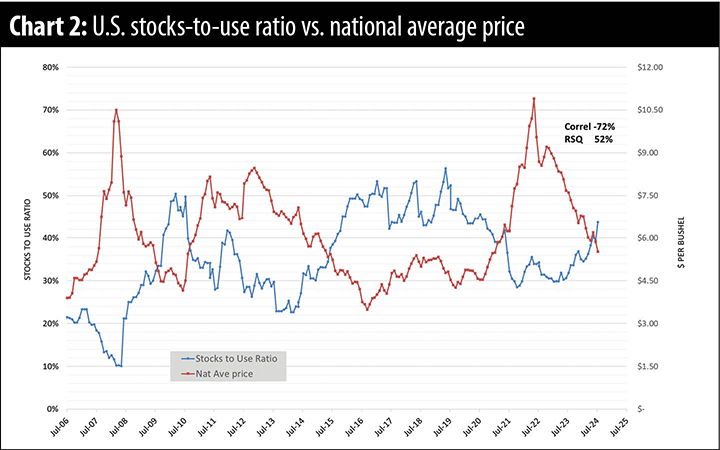
Traditionally, there have been two different schools of thought to analyze markets: technical analysis and fundamental analysis. Technical analysis looks at price movements on charts, and fundamental analysis looks at supply and demand factors. If we look at a chart showing the relationship between the U.S. monthly prices received by farmers and monthly stocks-to-use ratios reported in the World Agricultural Supply and Demand Estimates (WASDE) reports, it shows an inverse relationship where the stocks-to-use ratio goes up, the price goes down. There is a strong inverse correlation, -72%, between these factors.
But as things often go, there is a problem. The supply and demand numbers change each month as conditions change. First, we look at supply factors as the crop develops and proceeds toward harvest, and then we look at demand factors such as exports of grain. These numbers change each month, more at the beginning of the marketing year with fewer changes later. Over the course of the marketing year, the WASDE numbers move from a projection to an estimate to the final number. While it may seem trivial, a projection uses trends, an estimate uses partial data, and the final number uses collected data. In addition, there are times that the Quarterly Grain Stocks report reflects inaccuracies in the estimates. We saw this during the COVID epidemic, when domestic use of wheat products increased more than expected as people cooked more at home. See Chart 2.
Technical factors also reflect supply and demand. In its simplest form, the intersection of the supply and demand curve is the market price. Market prices move up if the quantity demanded is more than the quantity supplied, and vice versa. In addition, there may be shifts in the supply and demand curves. Of the nine shift combinations, market prices can be predicted in six of those combinations. But again, there is a problem. How do we determine the difference between movement along the curves and shifts in the curves? Sometimes the shift is obvious and sometimes it is subtle.
Can we put all of these imperfect factors into something that can be used in a decision tool to help market wheat?
A simple technical factor to add to our conditions is market trend. Is the market trend moving higher, lower, or sideways? So, let’s add to our conditions a trend for higher prices. Since 2006, there have been eight years that markets have trended higher. If we select those years as analogues, we get a chart like Chart 3.
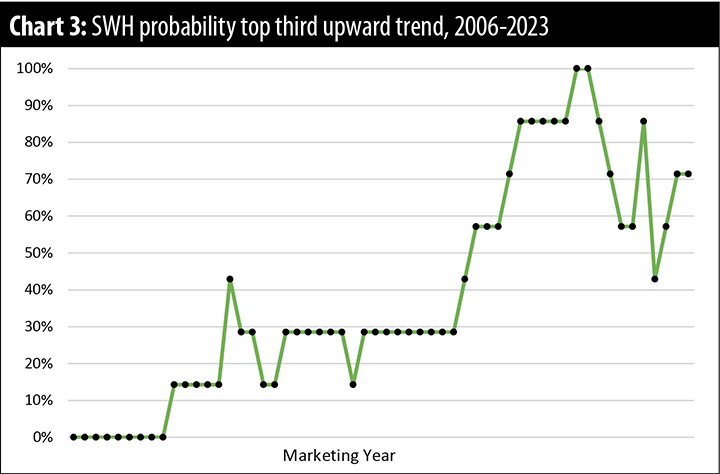
We now have a time period where the chance of getting a good price exceeds 50% and is in our favor! After Jan. 1, you have the best chance to get a good price and do a good job of marketing. But nothing is absolute. Remember to look at the flip side. If the chart shows a 70% chance of marketing in the top third, there is a 30% chance that you won’t.
Chart 4 shows the condition of a trend for lower prices. Since 2006, there have been eight years with a downward trending market. It also shows that you have a chance greater than 50% to market in the top third of the market. It just comes early! You need to market your crop before July 1 if you want to get a good price.
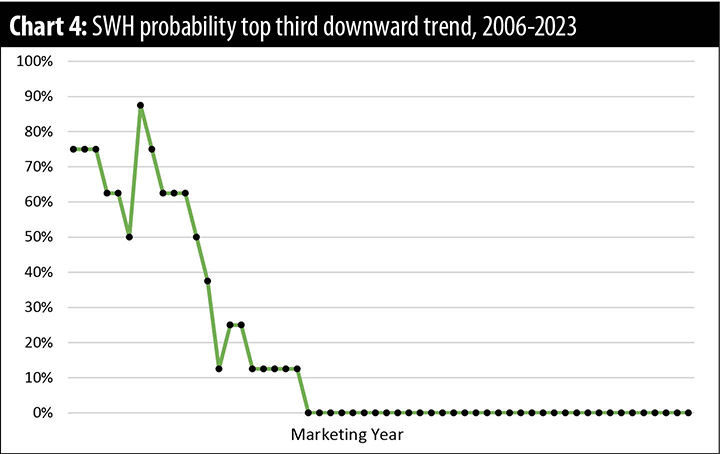
The downward trending market is the most difficult of the trends. First, you need to identify that it is downward trending market quickly, contrasted with the upward trending market that moves higher more slowly over time. The downward market will penalize you for waiting; procrastination is a killer. The upward trending market pays you for waiting; procrastination is rewarded.
Let’s take a look at the 2024-25 marketing year, using analytics, when we look for analogue years with similar fundamental and technical indicators. There was only one year that was a good analogue for the above conditions — 2009. Ideally, we would like three or more analogues to make a prediction, but there will be years with conditions that are not common, and analogues will be hard to find. Here is the price action for 2009 as compared to 2024. See Charts 5 and 6.
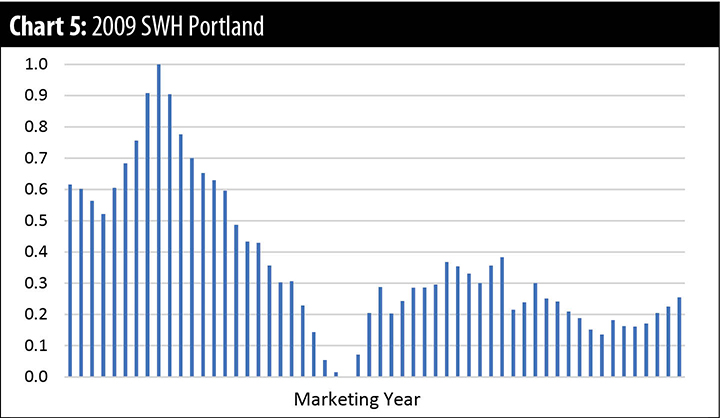
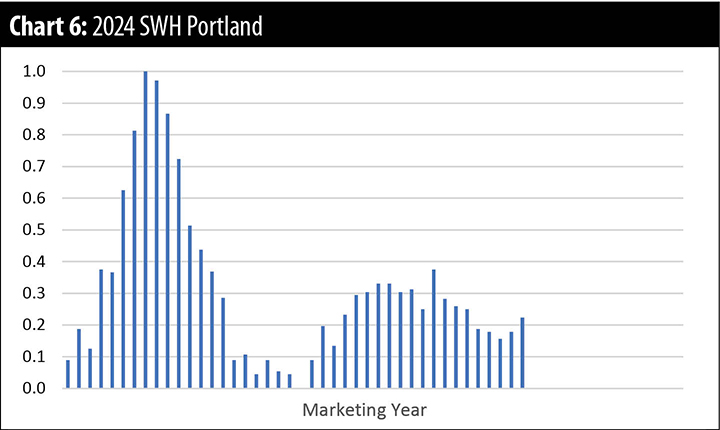
To date, Charts 5 and 6 look very similar. The timing of the market highs was within one week of each other, and the market lows were within four weeks of each other.
The use of analytics doesn’t replace a marketing plan but should be used in addition to it. The marketing plan should have projections of bushels to be marketed before harvest and then updated to the actual bushels after harvest. It should include cash flow requirements, working capital goals, and crop insurance coverage. Different marketing strategies should be included to be used as determined by the market trend. You may want to use minimum price contracts in a year with an up-trending market and hedge-to-arrive (HTA) contracts in a year with a down-trending market. Forward pricing is the most unused tool that is available to growers. While it may be hard to sell a portion of the crop you anticipate harvesting, the market trends down 44% of the time. The chart shown for downward trending years (Chart 4) shows the top third of the market happens before July 1. Ignoring forward pricing means that you give up getting a good price in those years.
In the movie, “Moneyball,” the Oakland Athletics were able to win the American League West with a payroll of $44 million compared to the New York Yankees payroll of $125 million. The Athletics didn’t make it to the World Series but lost to the Minnesota Twins in the American League Division Championship that year. We should have similar expectations when using analytics to market our wheat. Our goal should be to improve our game and not expect to win the World Series.
Howard Nelson is a retired agronomist and commodity broker. He worked for 31 years in the PNW grain industry and retired in 2020 from HighLine Grain Growers. He has a bachelor’s degree in agronomy from Washington State University and currently lives in Kennewick, Wash., with his wife, Cheryl. Nelson can be contacted at howardnelson73@gmail.com.