


The trend is your friend? Identifying the market trend lets producers choose the tools that best fit
2025October 2025
By Howard Nelson
Special to Wheat Life

The title of this article is one of those catch phrases that you may have heard over the years. It relays the fact that to make money trading commodities, you will make money as long as your trades align with the trend: selling short in a downtrend and being long in an uptrend. The difference is, I have posed this phrase as a question: “Is the trend your friend?” The wheat producer, by that title alone, is continually long wheat. If wheat is grown in your cropping system, you’re long wheat this year, next year, and the year after that; you just don’t know the quantity that you have to market. People with long positions make money in uptrends, not downtrends. Wheat producers should change this phrase to “uptrends are our friend!”
Let’s take a look at the trends the Portland soft white wheat market has shown for the past 53 years, since 1972. We’re going to use the date range of April 1 to April 30 of the following year for each marketing period (13 months). I use the phrases “upward trending” and “downward trending” for the markets because they seldom move in a direct line. There are times the prices “correct” and go up in a downward trend or go down in an upward trend.
Chart 1, for the year 2010-11, shows what I feel is a good example of the upward-trending market. It has a market low in June, and a market high in February. You can see what I mean by upward trending with many ups and downs between the market low and high. Let’s divide the 13-month marketing period into four marketing periods: spring/preharvest, summer/harvest, fall/postharvest and winter/postharvest to see if any characteristics emerge. In Chart 2, upward-trending markets for both time periods, 1978-2014 and 2006-14, typically have an early low, before July 1, in the marketing period. You could call the timing of the market low to be a “tell” indicating when you may expect the market high to occur, during the winter/postharvest period.
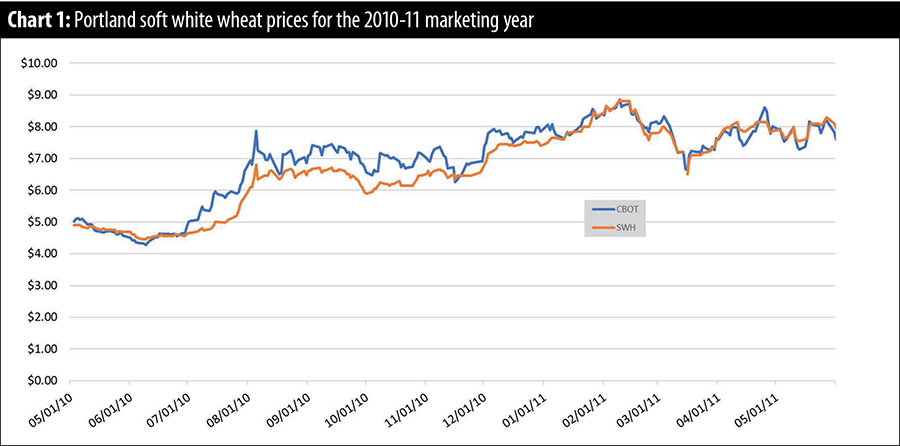
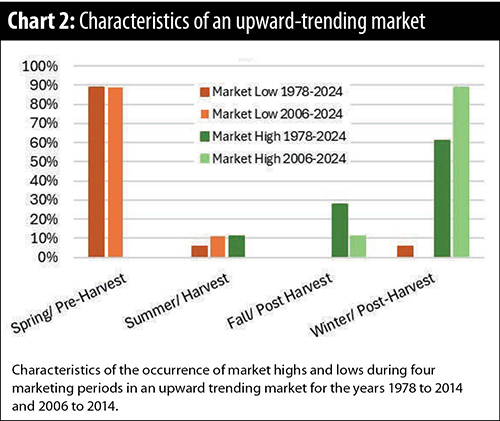
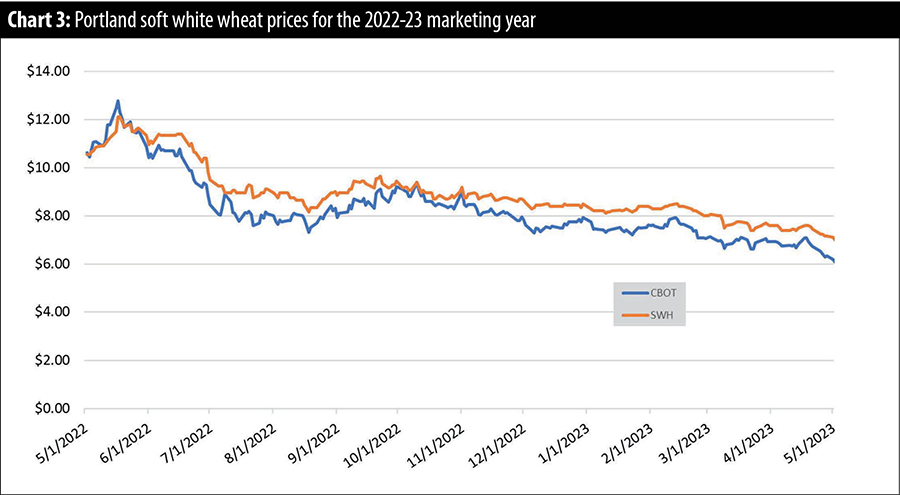
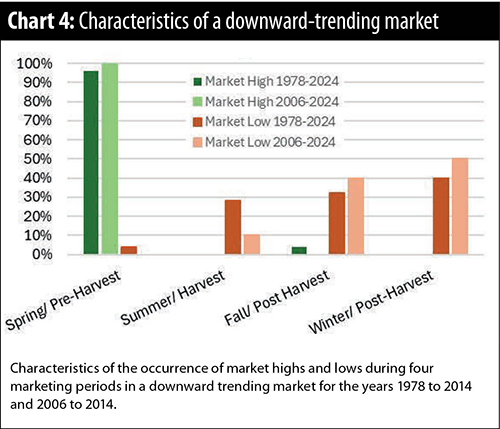
Chart 3, for the year 2022-23, shows what I feel is a good example of a downward-trending market. It has a market high in May and a market low in April. It also has many ups and downs between the market high and low. If we again divide the marketing year into four periods (Chart 4), we can look to see if any characteristics emerge for a downward-trending market. Its main characteristic is the high occurs during the first period, spring/preharvest. This requires you to recognize this trend quickly and determine if you want to forward price a portion of your anticipated crop.
The downward trend often penalizes you with lower prices the longer you wait, while the upward trend may reward you with higher prices by not taking action.
Since 1973, there have been 23 years (43.4%) that have been upward trending, 25 years (47.2%) that were downward trending, and five years (9.4%) that didn’t fit either pattern. Four of the five years that didn’t fit the pattern were what I call a late-low, an upward-trending market where the low came in the summer or early fall. This market presents itself as a downward-trending market only to make a late-low and then move higher into an upward trend. Trying to categorize the markets into nice and neat groups isn’t always easy, and some years don’t fit. Of the 53 years, 48 (90.6%) fit into either the upward or downward trend type.
We need a way to verify that the trend we have identified is true. This is where we look at the market fundamentals. Does the stocks-to-use ratios and their year-to-year or in-year changes support the market trend? The fundamental reports for each marketing year start in May using trends to make their projections. As we progress through the year, the trends are replaced with estimates and then actual data, so it takes several months of adjustments to zero in on the supply and demand situation. Market prices tend to show the supply and demand situation earlier than the reports, and it is good when both the technical and fundamental indicators support the trend.
Before we go further, we need to recognize that there is an additional factor that can influence the markets: geopolitical situations. We are currently in one of those periods with the tariffs that have been imposed on exports of U.S. products. We went through a similar situation during the 2018-19 crop year when tariffs were imposed on exports to China. The hard red winter wheat class reacted negatively that year showing a downward trend even though market fundamentals indicated that the market should have been positive. The soft white wheat market class reacted positively that year with an upward trend aligned with the market fundamental indicators. At the current time, market impacts remain uncertain as we negotiate new trade agreements with our trading partners.
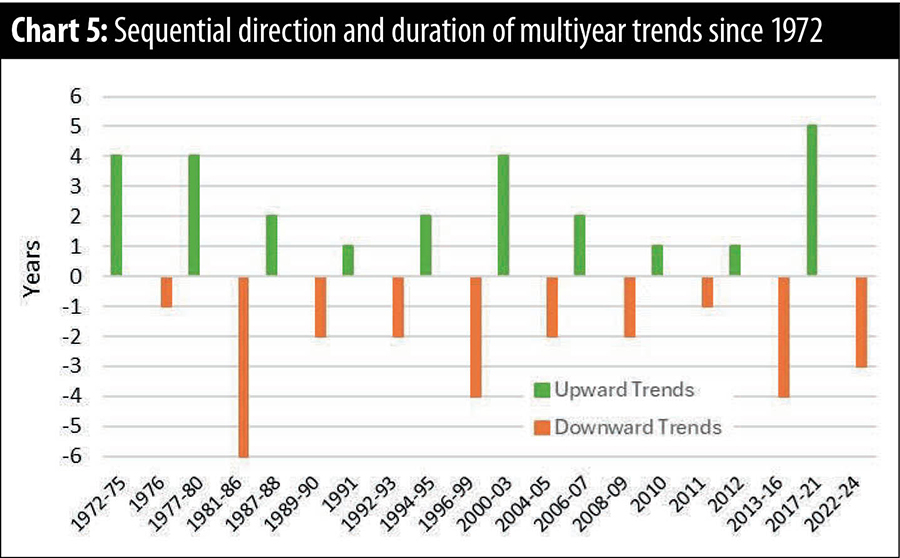
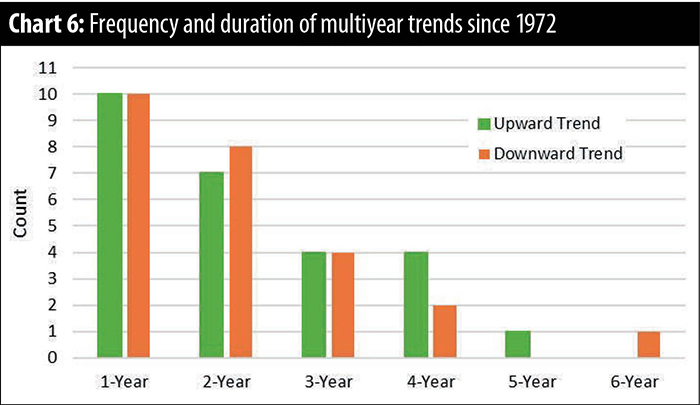
Now we need to discuss multiyear trends, which are trends that continue into the next marketing year. This is more common that you may realize. Chart 5 shows sequentially the direction of the trend and the trend duration starting with the 1972 crop year. During the past 53 years, the trend has changed 20 times, either from up to down or down to up. Five of those trend changes, 25%, happened after only one year, while 75% of the trends continued for multiple years. In Chart 6, the multiyear trends are grouped by duration and by upward or downward trends. When the market trend changed to an upward trend, it continued into a second year 70% of the time. When the market trend changed to a downward trend, it continued into a second year 80% of the time. Beyond that, upward and downward trends continued for additional years about 50% of the time.
If you can identify the market trend, you can then plan your marketing and choose the tools that best fit that trend. If the market is in an uptrend, you may choose to delay your cash sales as long as you can. You could also use minimum-price contracts (more on this in a later article) if you need to market wheat early in the year for cash flow reasons. If the market is in a downtrend, you need to market your wheat as quickly as possible. Forward pricing and hedge-to-arrive contracts should be used. The trend can be your friend if you know how to use it to your advantage.
The information in this presentation should not be considered a solicitation. Past performance, whether actual or indicated by simulated historical tests of strategies may not be indicative of future results. Trading advice reflects good faith judgment at a specific point in time and is subject to change without notice. There is no guarantee that the advice given will result in profitable trades. Any strategy that involves trading futures or option contracts can involve losses that may be substantial and not suitable for everyone. Each person should carefully consider if trading futures is appropriate because of their financial condition.
Howard Nelson is a retired agronomist and commodity broker. He worked for 31 years in the PNW grain industry and retired in 2020 from HighLine Grain Growers. He has a bachelor’s degree in agronomy from Washington State University and currently lives in Kennewick, Wash., with his wife, Cheryl. Nelson can be contacted at howardnelson73@gmail.com.