


Let’s make a marketing plan (Part 2) Technical, fundamental factors go into making a market outlook
2026March 2026
By Howard Nelson
Special to Wheat Life

This article continues our marketing plan discussion from the February 2026 issue of Wheat Life.
The next step in making a marketing plan is to form a market outlook. It is hard to do this objectively because our natural inclination is one of hope — for higher prices — but hope is not part of our marketing plan. We need to take a cold hard look at the market and try to be objective. Our market outlook is formed by looking at both technical and fundamental factors. The technical factor that we look at is what the trend is going to be this year.
For more information on trends, see my article in the October 2025 issue of Wheat Life.
The fundamental factor that we look at is the stock-to-use ratio (STU). The STU ratio is a result of interactions between supply and demand and is calculated when you divide the projected ending stocks (carryout) by the projected demand. It can be shown as a formula: STU = carryout/demand. Carryout is determined when the projected demand is subtracted from the projected supply. If we substitute this into the formula, it becomes: STU = (supply – demand)/demand
The STU ratio is an indication of scarcity. If the STU ratio is moving lower, then the grain is getting more scarce, and if the STU ratio is moving higher, less scarce. It’s when the STU ratio makes big changes that things get interesting! Now, if that isn’t enough, there are three different STU ratios to watch: the world STU ratio, the U.S. STU ratio, and the white wheat STU ratio. By watching the changes in STU ratios, we get an idea what the trend may be for the year.
In my first article, which appeared in the March 2025 issue of Wheat Life, I showed the relationship between the STU and the price received by the farmer. This relationship showed a good inverse relationship of -72%. It also showed that the R squared value for this relationship was 52%. What this means is that while there is a good inverse correlation, we are not able to accurately project a price based on this relationship. To say this more simply, market trends can be predicted but market prices are not predictable.
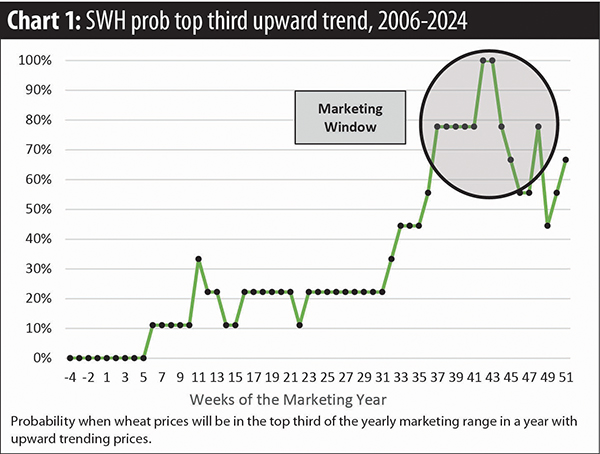
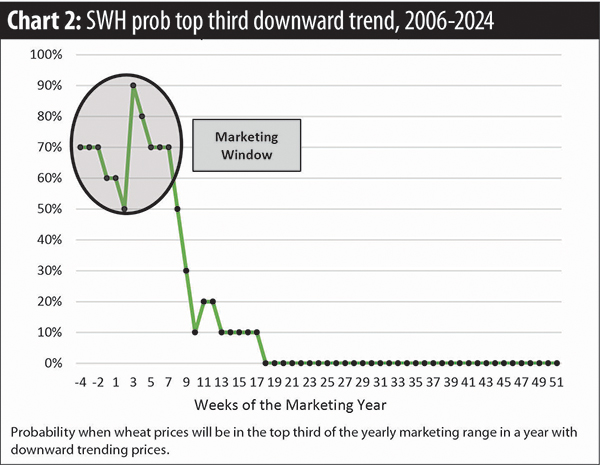
Now let’s bring analytics into our marketing plan. When can we expect the top third of the market range in an upward trending market or the top third of the market range in a downward trending market? Chart one shows the marketing window with the highest probability that the top third of the market range will be achieved in an upward trending market. Chart two shows the marketing window with the highest probability that the top third of the market range will be achieved in a downward trending market.
In addition to looking at market trends, we can look for analogue years, or past years that had similar trends, STU values, and changes in STU values. For the 2025-26 marketing year, there are four analogue years, 2015-16, 2016-17, 2023-24 and 2024-25. Chart three shows when the probability of the top third of the market range occurred using those analogue years.
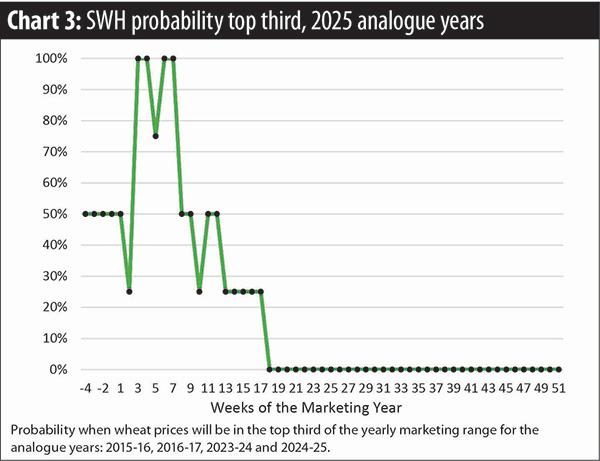
Chart four is a flow chart to help us make marketing decisions and choose the best marketing tool based on the projected market trend. By using the flow chart, you recognize that in an upward trending market year, the best probability of good prices come late in the marketing year, during the winter months, and in a downward trending market year, the best probability of good prices come early, before harvest. In upward trending years, your best marketing strategy is to hold and delay marketing or to use minimum price contracts. In downward trending years, your best marketing strategy is to forward contract or sell futures contracts (hedge) or use hedge-to-arrive contracts. Trends usually continue for multiple years, so we may use the same marketing tools again in following years until the trend changes.

There is one thing missing from this discussion on wheat marketing: cash flow needs. This is not a problem in downward trending markets because if a grower follows its seasonal pattern, the marketing window comes early, and there will be cash from forward pricing. There is little advantage to holding grain in a downward trending market, so any remaining wheat should be sold shortly after harvest. Cash flow can be a problem in upward trending markets as the desire to hold for the marketing window is met by the need for cash. Growers may want to consider minimum price contracts to maintain the ability to profit from higher prices that could occur after the crop is marketed.
How does crop insurance fit into our plan? If we’ve taken the revenue coverage type of crop insurance, we’ve had protection from the time the policy was taken out until the following August when the harvest price is set. Once the harvest price is set, we are again at risk if prices go lower. We still need to be aware of the market trend and time our marketing sales according to that trend.
Now comes the hardest part of the plan: implementation or selling your crop using the marketing plan that was developed. This is where you need to “keep your head in the game” or “keep your eye on the ball” or maybe “don’t blink.” Remember, we’re not trying to sell at the market top, but in the top third of the market range. A goal is something that we are trying to achieve that isn’t easy, but something that can be reached. If we fall short of the goal, take a look at why it wasn’t achieved and make adjustments for next year. Was it something that was in our control or out of our control?
This concludes my series of articles on marketing. This was a project that I started as a way to fill my time during the “Covid Era” and has taken four years and three versions to put together. Luckily, I already had daily price data for the Portland wheat market going back to 1980 and weekly price data before that to 1972. A thank you goes to Curtis Evanenko of McGregor Risk Management LLC that provided me the current crop insurance data for my farm. The other information that I needed was available on the internet. I hope that you have found the information that I presented helpful and helps you make better marketing decisions on your farm.
The information in this presentation should not be considered a solicitation. Past performance, whether actual or indicated by simulated historical tests of strategies may not be indicative of future results. Trading advice reflects good faith judgment at a specific point in time and is subject to change without notice. There is no guarantee that the advice given will result in profitable trades. Any strategy that involves trading futures or option contracts can involve losses that may be substantial and not suitable for everyone. Each person should carefully consider if trading futures is appropriate because of your financial condition.
Howard Nelson is a retired agronomist and commodity broker. He worked for 31 years in the PNW grain industry and retired in 2020 from HighLine Grain Growers. He has a bachelor’s degree in agronomy from Washington State University and currently lives in Kennewick, Wash., with his wife, Cheryl. Nelson can be contacted at howardnelson73@gmail.com.