


Thanks to the impact of the 2021 drought on wheat’s value of production, the crop slipped from No. 3 to No. 4 in the list of Washington state’s top 10 agricultural commodities last year. Apples remained at the top of the list, followed by milk, then cattle and calves, which moved from fifth place to third. Following wheat’s fourth-place finish was potatoes, which was No. 4 in 2020. Hay, hops, sweet cherries, grapes and blueberries rounded out the top 10 list.
Wheat’s value of production lost just over 20% from 2020 to 2021. That decrease isn’t a surprise to growers, but the size of it could be jarring to those less familiar with the industry.
“We all know it was a tough year on yields because of how dry it was in 2021. One saving grace was that the prices were quite a bit higher for the 2021 crop than they were for 2020,” said Dennis Koong, Northwest Regional Field Office director for the U.S. Department of Agriculture’s National Agricultural Statistics Service (NASS).
The decrease in wheat’s value was big enough that it depressed the state’s total value of crop production, despite big increases in several other commodities.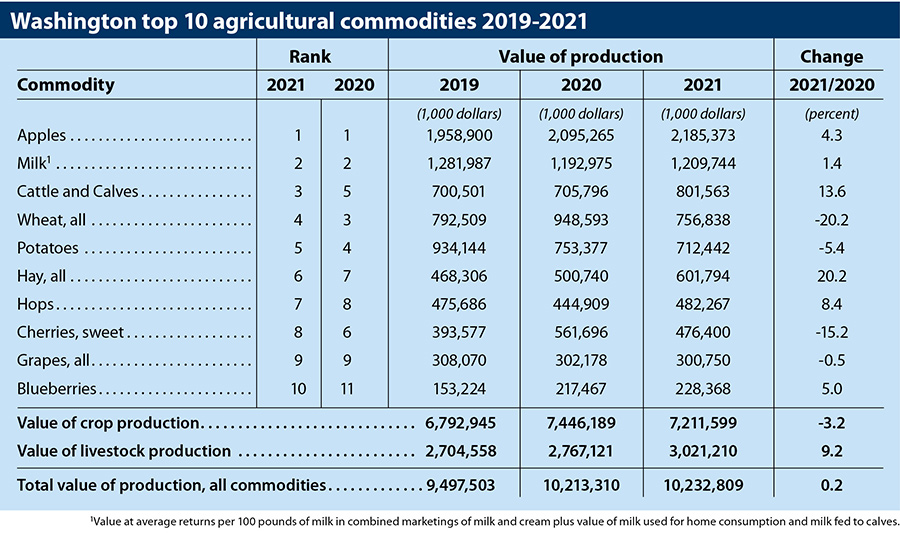
“You can see that the value of crop production decreased 3% in 2021 from 2020. That doesn’t really tell the story of grains, because apples actually increased,” Koong explained. “Even though apple production was down in 2021, the price was up slightly, so that led to apples, which is obviously the No. 1 crop in the state, being up 4%. Even with that, the value of crop production, as a whole, was down 3%, and that was largely due to the wheat value being down so much.”
The other crop that Koong pointed out as newsworthy was hay. That commodity’s value increased 20% in 2021, driven mainly by price.
NASS has also released their 2022 Washington Annual Statistical Bulletin, which, somewhat confusingly, summarizes the 2021 crop and livestock year. Koong explained that while the commodities are harvested in 2021, they are marketed and sold through the summer of 2022. The information NASS gathers for the bulletin comes from several sources, including grower surveys and entities who purchase commodities.
“The biggest thing that jumps out at me is the diversity (of crops) we have in our state,” Koong said. The annual bulletin can be downloaded from NASS’s website.
Highlights from the bulletin include:
- Winter wheat’s yield per acre dropped from 76 bushels in 2020 to 42 bushels in 2021. Spring wheat yields dropped from 61 bushels per acre in 2020 to 30 bushels per acre in 2021. Barley fared even worse, dropping from 90 bushels per acre in 2020 to 38 bushels in 2021.
- The most wheat (both winter and spring) harvested was in 1976, when 3.2 million acres was harvested. The lowest was 82,000 acres in 1879.
- 2016 saw the highest average yield of all wheat at 71.5 bushels per acre. The lowest was in 1918 with 12.5 bushels per acre.
- Barley follows the same arc: 1985 had the most acres harvested with nearly 1.2 million acres while 1882 had the lowest with 24,000 acres. In yield, 2016 had the highest average, with 77 bushels per acre, while 1918 had the lowest at 13 bushels per acre.
- Oats’ heyday was in 1909 when 270,000 acres were harvested, compared to 2009 when only 2,000 acres were harvested. Yield, however, increased over time, with 2004 clocking in at 88 bushels per acre vs. 1918 at 33.5 bushels per acre.
- The average number of farms in Washington has decreased from 37,300 in 2012 to 35,300 in 2021, while the average farm size has increased from 394 acres to 411 acres in that same time period.
- The marketing year average price for all wheat in 2021 was $8.67 vs. $4.16 in 2016.
- In 2021, producers paid approximately 3% more, compared to 2011, for chemicals and 25% more for supplies and repairs. Machinery was up 46% over 2011.
- In 2021, Whitman County led all counties in the production of winter wheat with 18 million bushels. Lincoln County was second with 10.2 million bushels, followed by Adams County with 9.3 million bushels.
- Growers have steadily been planting less barley, from just over 200,000 acres in 2013 to 83,000 acres in 2021.
- Once again, growers in Whitman County planted the most barley in 2021 with 31,500 acres, followed by Columbia County (8,600 acres) and Spokane County (8,500 acres).
In other NASS news, Koong asked producers to be on the lookout for the 2022 Census of Agriculture questionnaires, which will mostly be mailed out in December. Data from the census is used by federal and state governments, as well as agribusinesses, researchers and many others. The census is conducted every five years and looks at land use and ownership, producer characteristics, production practices, income, and expenditures.
“This (the ag census) is going to be the most in-depth look that we have at agriculture in the state and in the U.S. at the county level,” he said, emphasizing the need for producers to completely and accurately fill in NASS surveys. “With higher response rates and getting cooperation from the growers, it ensures we publish more accurate data. It’s really the cornerstone of the reliability and the accuracy of our data.”